
Visme (visme.co) is a visual content creation platform that helps marketers, educators, business owners, and teams design presentations, infographics, documents, reports, and social media graphics without needing design expertise. Launched in 2013 with a focus on online presentations and infographics, Visme has since expanded into a broader content creation suite, adding data visualisation tools, branded templates, whiteboards, social media graphics, and — most recently — AI-driven design automation. The platform is positioned as particularly strong for content that needs to communicate data: live data widgets can connect directly to spreadsheets and data sources, updating charts and visualisations automatically as the underlying data changes.
Visme's AI capabilities include an AI slide generator that builds presentation drafts from a topic or outline, automating much of the initial design and layout work. Brand Kit functionality lets teams apply consistent fonts, colours, and logos across all content, while interactive elements — pop-ups, hover effects, clickable hotspots, and embedded video or audio — allow Visme documents to function more like mini-applications than static slides. The platform supports white-label client portals on higher tiers, and meets GDPR standards with HIPAA support available via signed BAA on eligible plans, making it usable for healthcare-adjacent content workflows.
How Visme Works
Users start with a blank canvas or one of Visme's templates for presentations, infographics, documents, social graphics, or reports. The AI slide generator can create an initial draft from a topic description, which users then customise using Visme's drag-and-drop editor — adjusting layouts, adding charts, icons, images, and interactive elements. For data-heavy content, users connect live data sources (such as Google Sheets) to data widgets, which automatically update embedded charts and visualisations as the source data changes — useful for recurring reports that need to stay current without manual rebuilding. Brand Kit settings ensure that fonts, colours, and logos remain consistent across every piece of content created by a team. Finished projects can be exported as images, PDFs, presentations, or published as interactive web content and shared via a link or embedded elsewhere.
Key Features
- AI slide generator — automatically generates presentation drafts from a topic or outline, accelerating initial design and layout
- Live data widgets — connect charts and visualisations directly to data sources like Google Sheets so they update automatically as data changes
- Brand Kit — apply consistent fonts, colours, and logos across all content created by a team for on-brand output
- Interactive content — add pop-ups, hover effects, clickable hotspots, and embedded video or audio to make documents function like mini-apps
- Extensive template library — templates for presentations, infographics, documents, reports, social media graphics, and more
- Data visualisation tools — charts, graphs, maps, and other data visualisation formats for turning raw numbers into clear visuals
- Collaboration tools — commenting, file sharing, approvals, project permissions, and reusable content blocks (Pro and above)
- White-label portals — support for custom domain, favicon, and brand visuals on client-facing portals (higher tiers)
- Multiple export and publishing formats — export to PNG, JPG, PDF, or publish as interactive, shareable web content
- GDPR and HIPAA support — meets GDPR standards, with HIPAA compliance available via signed BAA on eligible plans
Visme Pricing
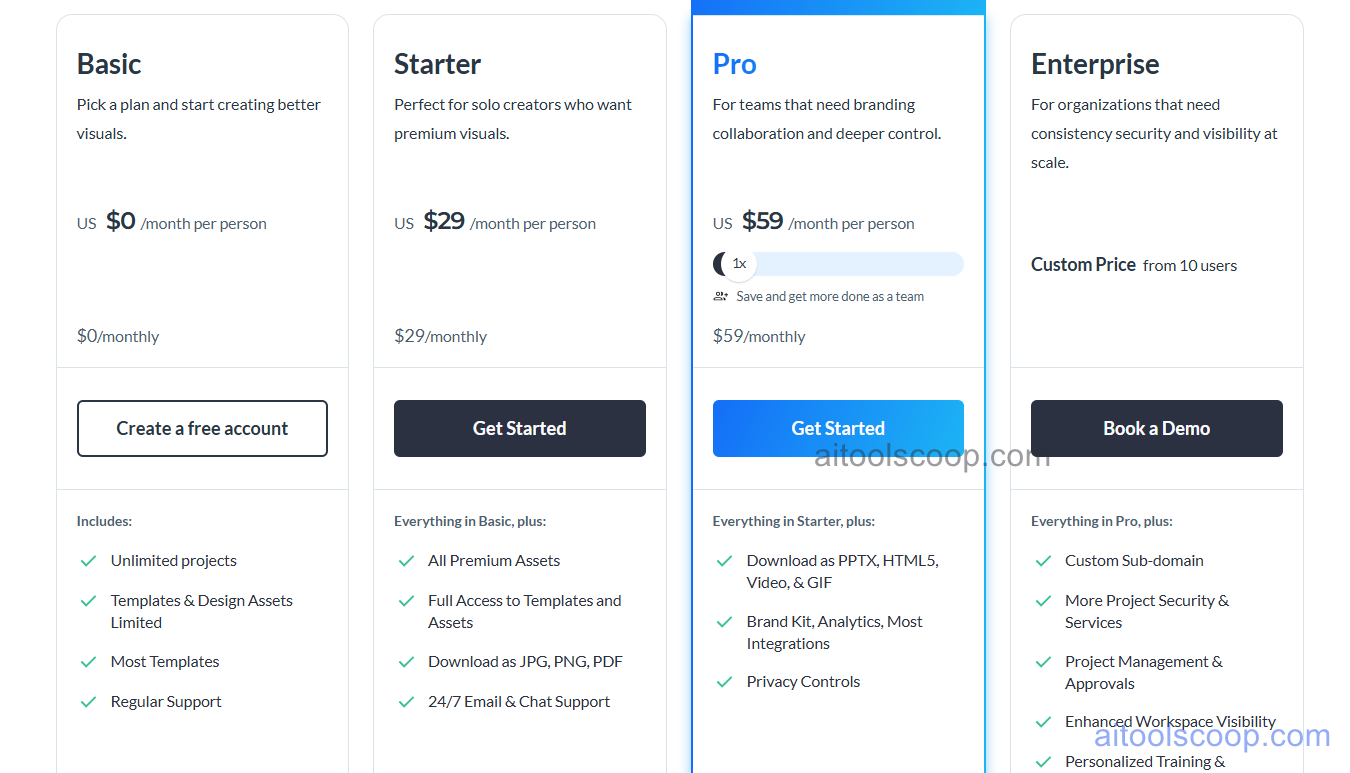
- Free — $0/month — 5 projects, access to basic templates, 500MB storage, and basic export formats (PNG, JPG). Includes a Visme watermark on exported content. Suitable for exploring the editor.
- Starter — $29/month ($12.25/month billed annually) — Unlimited projects, unlimited downloads, watermark removal, 1GB storage, and access to the broader template library. Designed for individuals working solo.
- Pro — $59/month ($24.75/month billed annually) — Everything in Starter, plus Brand Kit, analytics, 10GB storage, team collaboration features including approvals and project permissions, and access to premium templates and content blocks.
Enterprise plans with custom pricing add 25GB storage per user, advanced security and compliance options, and dedicated onboarding support. Student and nonprofit discounts are available. Always verify current rates at visme.co/pricing.
Who Should Use Visme?
Visme is a strong fit for marketers, educators, consultants, and small-to-medium businesses that regularly produce presentations, infographics, or reports involving data — particularly when that data needs to stay current via live data widgets. Its AI slide generator and large template library make it accessible for non-designers, while Brand Kit and collaboration tools on Pro support small teams maintaining consistent branding. Visme is primarily a visual content creation platform rather than a social media management tool, so teams needing scheduling and publishing across social platforms will need a separate tool. Users whose needs are mostly general graphic design (social posts, basic flyers) with a generous free tier may find Canva's free plan more immediately useful; Visme's advantage is in data-driven, interactive, and presentation-focused content.
Frequently Asked Questions
What is Visme?
Visme is a visual content creation platform for building presentations, infographics, documents, reports, and social media graphics. It combines an AI slide generator, live data widgets that connect to spreadsheets, Brand Kit tools for consistency, and interactive content features like pop-ups and embedded media, all within a collaborative editor.
Is Visme free?
Yes — Visme offers a free Basic plan that includes 5 projects, basic templates, 500MB of storage, and basic export formats (PNG, JPG), though exports include a Visme watermark. Paid plans starting at $29/month (or $12.25/month billed annually) remove the watermark and unlock unlimited projects and downloads.
What are live data widgets in Visme?
Live data widgets are charts and visualisations within a Visme project that connect directly to an external data source, such as a Google Sheet. When the underlying data changes, the chart or visualisation in the Visme document updates automatically, which is useful for recurring reports and dashboards that need to reflect current figures without manual rebuilding.
Does Visme have an AI slide generator?
Yes. Visme's AI slide generator can create an initial presentation draft based on a topic or outline provided by the user, automating much of the early design and layout work. Users can then refine the AI-generated draft using Visme's drag-and-drop editor, templates, and design tools.
How does Visme compare to Canva?
Canva offers a more generous free plan and a larger general-purpose template library for everyday graphic design, while Visme is more focused on data visualisation, interactive presentations, and live data integration from sources like Google Sheets. Teams that frequently create data-driven reports or presentations tend to prefer Visme; those needing broad general design work with the largest free template selection often prefer Canva.