
Interactive Data Visualization for Data Storytellers
Infogram (infogram.com) is a professional data visualization and interactive infographic platform trusted by leading media organizations, marketing teams, and enterprise data teams for creating compelling visual stories from complex datasets. Infogram goes beyond basic infographic design to offer real-time data connections, interactive charts and maps, live dashboard publishing, and team collaboration in a single platform. With 35+ interactive chart types, real-time data syncing from Google Sheets and other sources, and white-label publishing options, Infogram is built for organizations that need data to come alive rather than sit static in a PDF. It is the preferred infographic and dashboard tool at major publications and data journalism teams worldwide.
How Infogram Works
Create an Infogram account and start a new project by selecting a content type — infographic, report, chart, dashboard, social media post, or slide. Choose from hundreds of templates or start from scratch on a blank canvas. Connect your data by pasting it directly, importing from a CSV or Excel file, or linking a live Google Sheets connection that updates the visualization automatically when the source data changes. Build charts, maps, progress indicators, and data tables using Infogram's 35+ visualization types. Add text, images, icons, and video to create a complete narrative around the data. Publish the project as an interactive web embed, a shareable link, or a static download in PNG, PDF, or PowerPoint format.
Key Features
- 35+ interactive chart types — bar, line, pie, scatter, map, treemap, funnel, gauge, and more
- Real-time data sync — connect to Google Sheets for live data updates without re-uploading
- Interactive publishing — embed interactive charts and infographics on any website or CMS
- Live dashboards — build real-time data dashboards that update automatically from connected sources
- Maps and geospatial data — choropleth maps, point maps, and regional data visualizations
- Brand kit — apply consistent brand colors, fonts, and logos across all projects
- Team collaboration — shared workspaces for multi-user project editing and management
- White-label publishing — remove Infogram branding on higher-tier plans for client projects
- Multi-format export — download as PNG, PDF, or PowerPoint, or publish as interactive embed
- API access — integrate Infogram programmatically into custom applications and workflows
Infogram Pricing
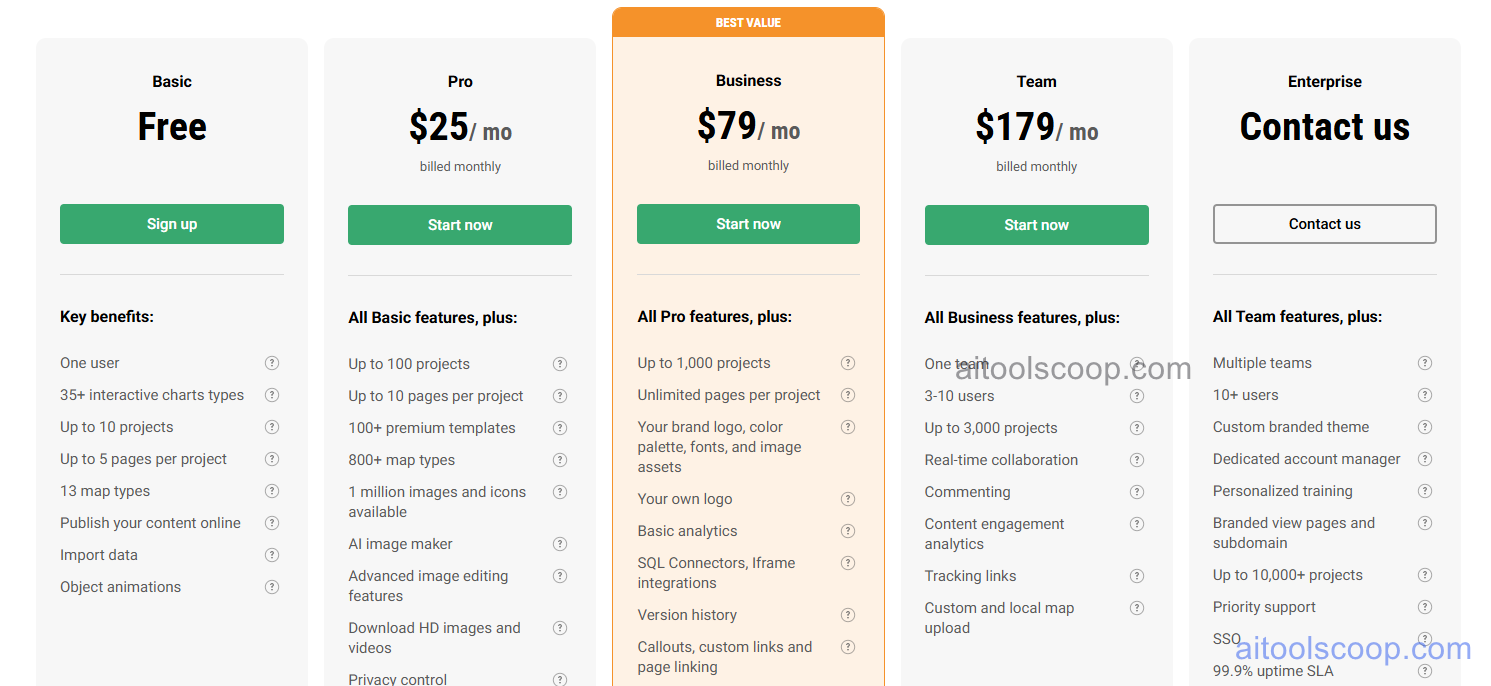
| Plan | Monthly | Annually | Key Inclusions |
|---|---|---|---|
| Free | $0 | $0 | 10 projects, basic chart types, public sharing, standard templates, Infogram branding |
| Pro | $25/mo | $19/mo | 100 projects, all chart types, Google Sheets sync, PNG and PDF export, brand kit, no watermark |
| Business | $79/mo | $67/mo | Unlimited projects, live dashboards, interactive embeds, team collaboration, PowerPoint export, priority support |
| Team | $179/mo | $149/mo | All Business features, white-label publishing, advanced team management, API access, dedicated support |
| Enterprise | Custom | Custom | All Team features, SSO, advanced security, SLA, dedicated infrastructure, custom integrations |
Always check the latest rates on the official website. For more AI tool reviews, visit aitoolscoop.com.
Who Should Use Infogram?
Infogram is best suited for data journalists and editorial teams at publications who need to produce interactive data stories that embed cleanly in digital articles, marketing and analytics teams creating live dashboards and data reports for internal stakeholders, agencies building white-label data visualization deliverables for clients, research organizations communicating statistical findings to public audiences, and communications professionals who need maps and geospatial data visualizations for regional data storytelling. The annual Pro plan at $19/month provides strong value for individuals who need professional chart quality and Google Sheets live sync.