

Grafana Cloud (grafana.com) is the fully managed SaaS version of the open-source Grafana observability stack, bringing together metrics (Prometheus/Mimir), logs (Loki), traces (Tempo), profiles (Pyroscope), and dashboards into a single cloud-native platform. It is built for software engineering and DevOps teams that want a complete observability stack without the operational overhead of running Prometheus, Loki, and Tempo themselves. The free tier includes 10,000 metric series, 50 GB of logs, 50 GB of traces, and 3 active users — enough for small teams and startups to run production observability at zero cost. Paid plans start at $19/month (platform fee) with usage-based billing on top. An enterprise-grade Advanced tier and a self-hosted open-source edition are also available.
The platform leverages AI and machine learning for anomaly detection, root cause analysis acceleration, and LLM-powered query assistance, allowing engineers to move from alert to resolution faster. Grafana Cloud supports OpenTelemetry for modern application telemetry ingestion alongside native Prometheus and Loki integrations, and provides enterprise security features including SAML SSO, role-based access control, audit logging, SOC 2 compliance, and a FedRAMP High–authorised deployment option (Grafana Federal Cloud) for government and regulated industries.
How Grafana Cloud Works
Teams connect their existing Prometheus, Loki, or OpenTelemetry agents to Grafana Cloud endpoints — the switch from self-managed Grafana is typically one endpoint change, with PromQL queries and dashboards transferring directly. The platform handles ingestion, storage, retention, high availability, and scaling. Engineers build dashboards and set alerts in the familiar Grafana UI, while the platform's AI layer surfaces anomalies and suggests related signals during incidents. k6 load testing and synthetic monitoring are included natively, rounding out the observability picture beyond infrastructure metrics.
Key Features
- Unified observability — metrics, logs, traces, profiles, and dashboards in a single platform with correlated drill-down across signals
- AI/ML-powered insights — anomaly detection, LLM-assisted query generation, and AI-driven root cause correlation to accelerate incident resolution
- OpenTelemetry support — native OTel ingestion alongside Prometheus, Loki, and other existing integrations without agent replacement
- Grafana Alerting — included at no additional cost across all plans, with multi-channel notification routing
- k6 load testing — integrated synthetic and load testing with results visualised directly in Grafana dashboards
- Synthetic monitoring — proactive uptime and endpoint health checks from global probe locations
- FedRAMP High authorisation — Grafana Federal Cloud for government and regulated industries with the highest compliance tier
- SOC 2 compliance — enterprise security with SAML SSO, RBAC, and audit logging on Advanced plans
- 13-month metric retention — 13 months for metrics and 30 days for logs, traces, and profiles on paid plans
- Generous free tier — 10K metric series, 50 GB logs, 50 GB traces, 3 users, 14-day retention, no credit card required
Grafana Cloud Pricing
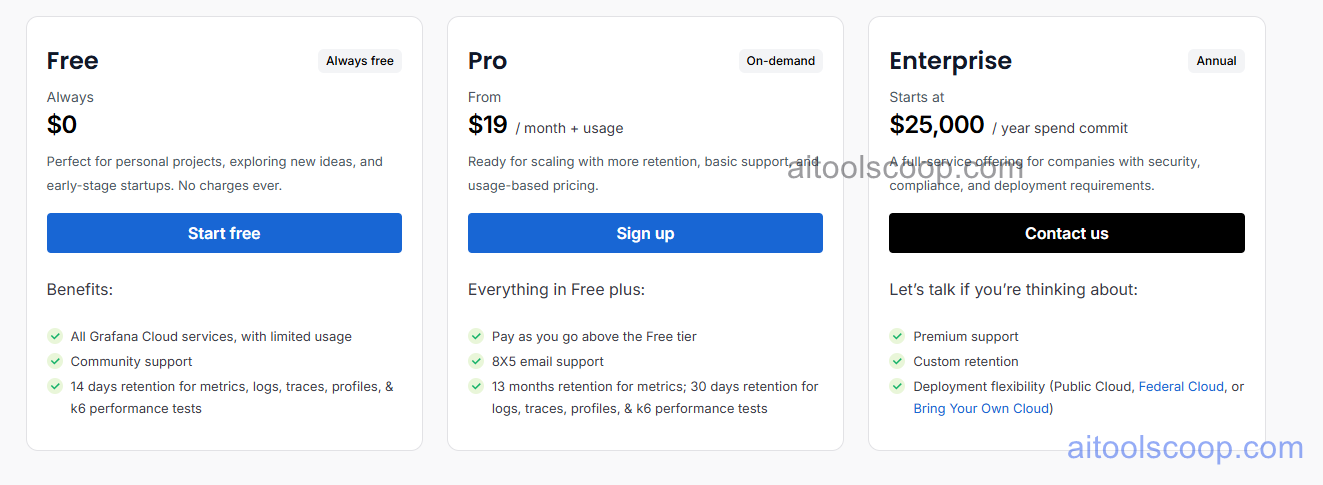
- Free — $0/month — 10,000 metric series, 50 GB logs, 50 GB traces, 3 active users, 14-day retention. No credit card required. Suitable for small teams and personal projects exploring full-stack observability.
- Pro — from $19/month — $19/month platform fee plus usage-based billing: ~$6.50 per 1,000 additional metric series, ~$0.50/GB for logs and traces, $8/month per additional active editor seat. First 3 active users included. Supports CI/CD, alerting, and production observability workloads.
- Advanced — from $55/month — All Pro features plus enterprise security (SAML SSO, fine-grained RBAC, audit logs), advanced data sources, priority support SLA, and 13-month metric retention. Pricing typically negotiated for larger teams.
Open-source Grafana OSS is completely free to self-host (Apache 2.0 license). Enterprise on-premise licensing also available. Always verify current rates at grafana.com/pricing.
Who Should Use Grafana Cloud?
Grafana Cloud is ideal for engineering and DevOps teams that already use or plan to adopt Prometheus, Loki, or OpenTelemetry, and want to eliminate the operational burden of maintaining their own observability infrastructure. The free tier makes it accessible to startups and individual developers, while the Advanced tier and FedRAMP option serve large enterprises and government organisations. Teams that need business-level BI dashboards rather than infrastructure observability, or those with strict data residency requirements outside Grafana's supported regions, may need to supplement or replace Grafana Cloud with a dedicated BI or APM tool.
Frequently Asked Questions
What is Grafana Cloud?
Grafana Cloud is a fully managed, cloud-hosted observability platform that unifies metrics, logs, traces, profiles, and dashboards in a single place. It is the managed SaaS version of the popular open-source Grafana stack, handling infrastructure, scaling, and retention so teams can focus on monitoring their applications rather than their monitoring stack.
Is Grafana Cloud free?
Yes. Grafana Cloud has a permanent free tier with 10,000 metric series, 50 GB logs, 50 GB traces, 3 active users, and 14-day retention — no credit card required. The open-source Grafana OSS is also completely free to self-host. Paid plans start at $19/month for the Pro tier with usage-based billing.
How does Grafana Cloud pricing work?
Grafana Cloud Pro charges a $19/month platform fee plus usage-based overages: roughly $6.50 per 1,000 billable metric series beyond the free allocation, about $0.50/GB for logs and traces, and $8/month per active editor seat beyond the first three. The Advanced tier at $55/month adds enterprise security and support features. Costs can escalate for high-cardinality metrics workloads, so it is worth estimating data volumes before committing.
Can I migrate from self-hosted Grafana to Grafana Cloud easily?
Yes. Dashboards and PromQL queries transfer directly, and migration typically involves only changing the Prometheus remote write and Loki push endpoints to point at Grafana Cloud. Most teams complete a basic migration in hours. Grafana provides official migration guides and the Grafana Cloud Agent simplifies configuration.
Is Grafana Cloud FedRAMP compliant?
Yes. Grafana Federal Cloud is a separate deployment authorised at FedRAMP High, the highest compliance tier, designed for US government agencies and regulated industries with strict data security requirements. Standard Grafana Cloud is SOC 2 compliant with SAML SSO, RBAC, and audit logging on Advanced plans.